Case study · DrDash
DrDash
Practice intelligence for NHS primary care
Product lead · 2026 · Built with a UK-based partner who runs sales and practice relationships
Visit drdash.co.uk ↗30+
NHS data sources
8
management areas
3
levels of detail
~2 months
to live
The problem
The NHS publishes a huge amount of data about every GP practice in England, every month. Appointments, phone waits, workforce, QOF, patient survey results. It's all public, and almost none of it is usable by the people running the practice. It sits across more than 30 sources, on different release schedules, in inconsistent formats.
Practice managers end up with no clear view of where they're falling behind on access targets or leaving income unclaimed. The tools that exist are built for clinicians and analysts, not for someone with twenty minutes on a Monday morning. The 2026/27 GP contract added new access measures, and no free tool tracks them yet.
The call I made
I didn't want to build another dashboard. Practices already have charts. What they don't have is something that tells them which number matters this month.
So I positioned DrDash around gaps rather than data: what's slipping, compared with what, and what to check. When I mapped the competition, Access & Demand was the only high-priority area with no free tool covering it. That became the wedge. I also split the product early into a practice product and a network product, because the people buying them have different jobs.
Gaps, not charts.
What I built
LiveA Python pipeline that pulls more than 30 NHS published sources together, across six areas: GP appointments, QOF, workforce, the GP Patient Survey, ODS reference data and population figures. It's built around the known problems in NHS data, like inflated patient lists and source releases that fail or arrive late.
Underneath it is a versioned metric registry. Every metric records where it came from, what level it can be attributed to, and how confident it can be. Those rules are built into the schema, so the product can't overclaim even as it grows. A finding only gets a status if it passes minimum sample sizes and NHS confidence intervals.
It runs on Next.js and Vercel, with Supabase in the London region behind an authenticated admin portal. I took it from competitive analysis to a live, demo-ready product in about two months.
Three levels of detail
Every finding can be followed from the headline down to the figures behind it.
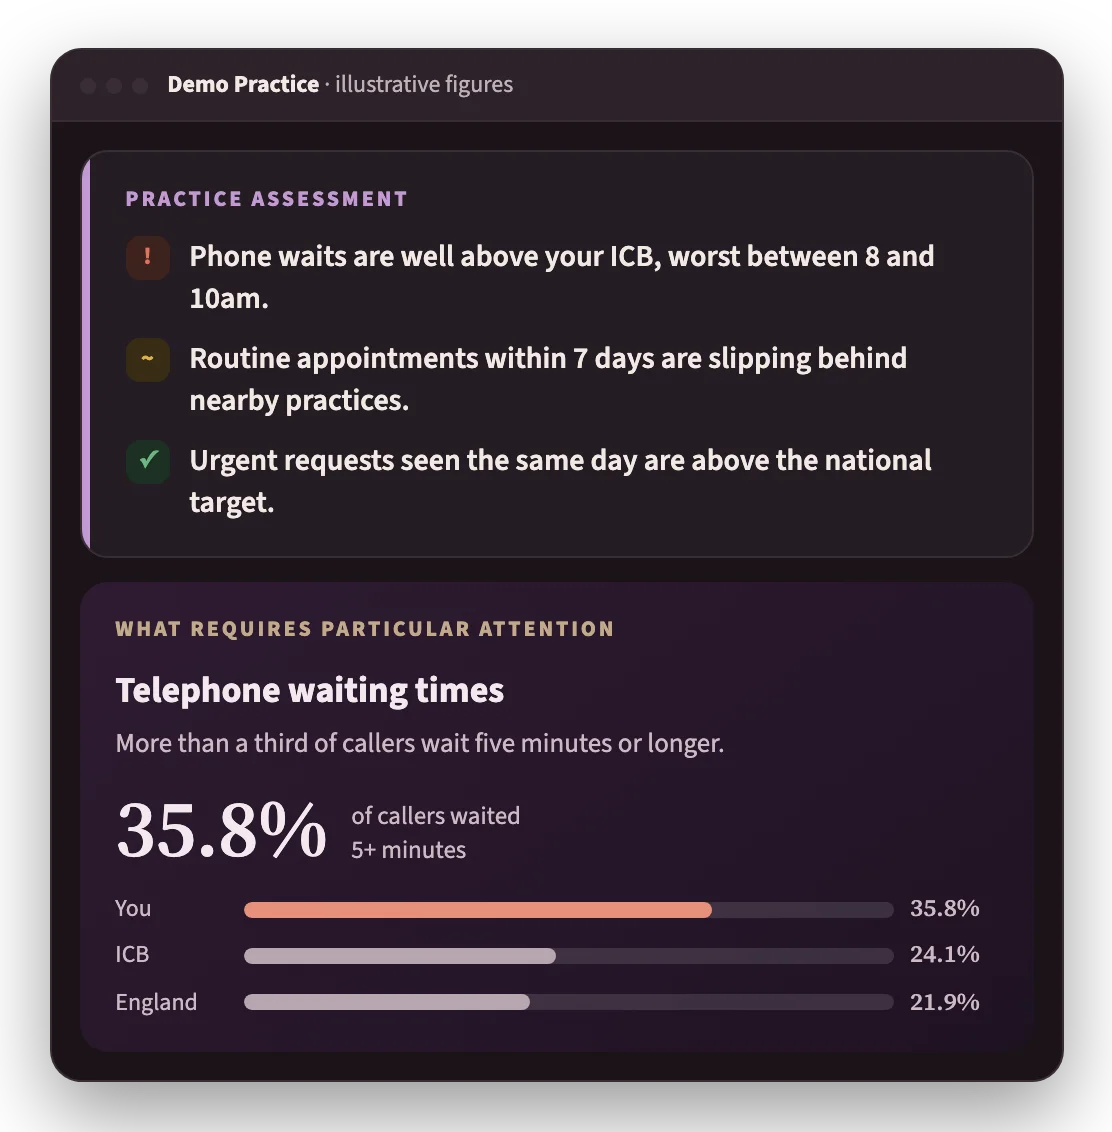
L1 · See what matters first
One page shows how the practice is doing and what needs attention this month.
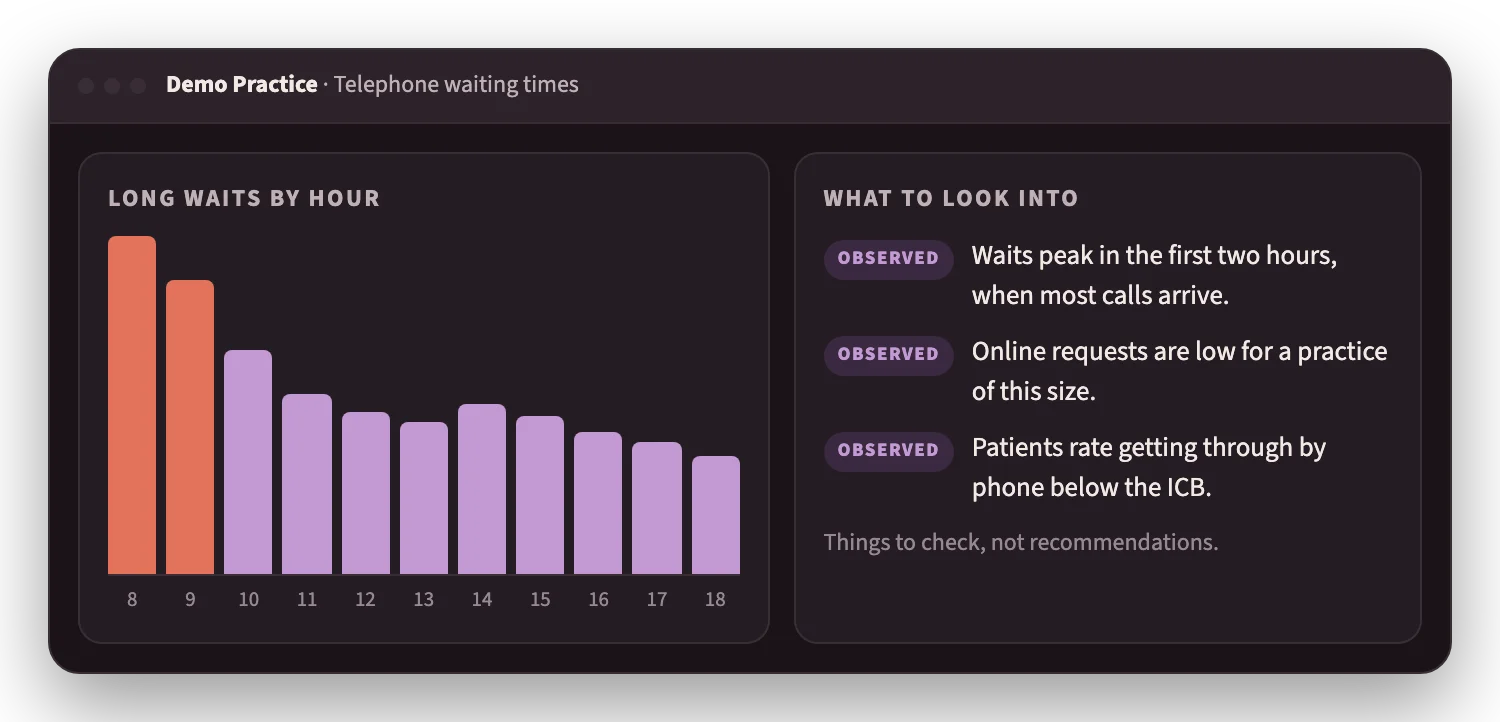
L2 · Understand why
Each of the eight areas shows where the pressure is, with things to check.
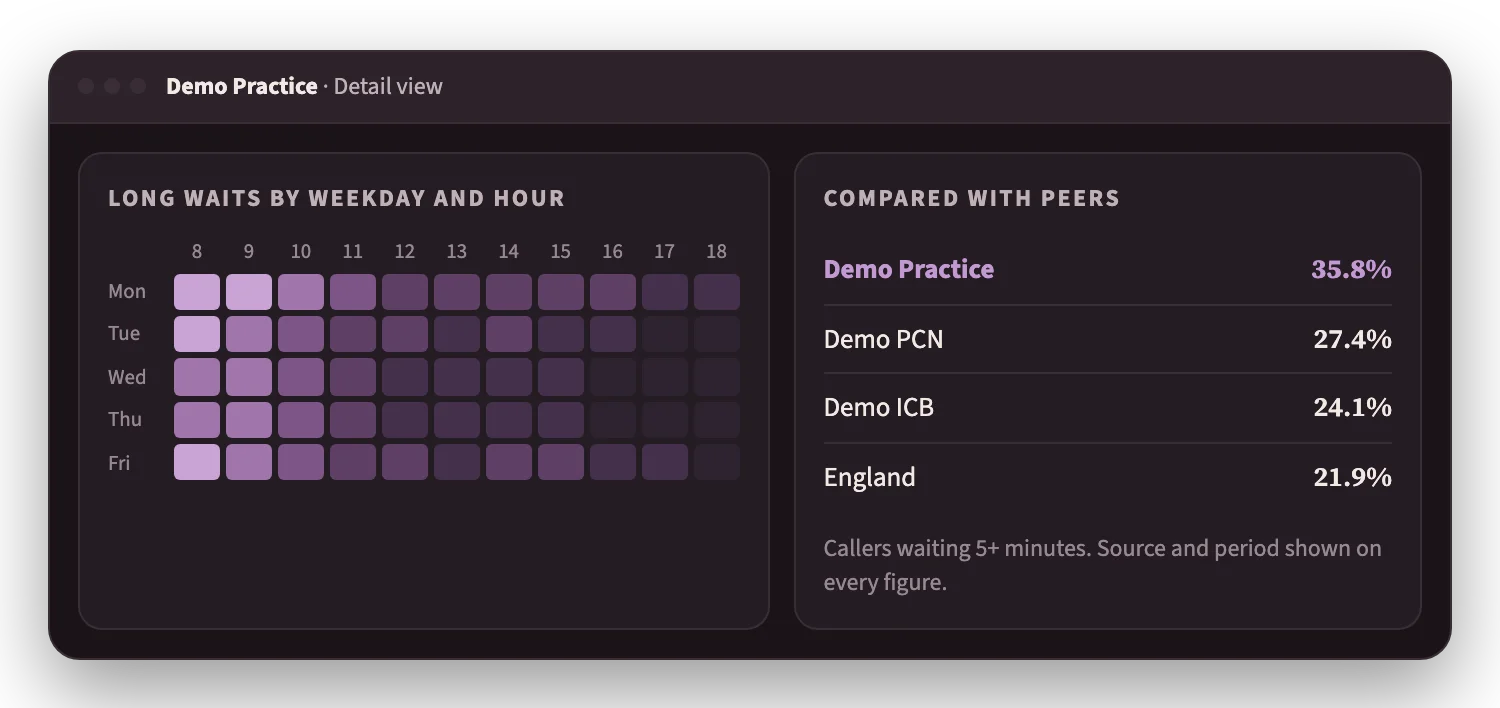
L3 · Check the detail
The figures behind every finding, with the PCN, ICB and England alongside, and the source and period on each.
Where AI fits
AI built most of this. I directed the build through an AI-assisted workflow with Claude Code. I wrote specs, audited the real state of the code before each change, and checked everything it produced against the data. That's how one product lead and a partner got a multi-source data platform live in two months.
In the product itself, I chose to get the rules right before adding AI. In primary care, a wrong number about a practice is worse than no number. An AI summarising data it can't verify would break trust with the first practice manager who checks it. So every finding is decided by rules first, with its source and confidence attached. The AI layer comes next, and its job is to explain findings the rules have already verified, not to generate new ones.
Now: how it's built
Next: in the product
What the demo taught me
In October 2026 we demoed DrDash live to GP partners and practice managers at an industry conference. The clearest feedback was about priority. Practices care most about how quickly clinically urgent requests are seen, and that view wasn't prominent enough. We're reworking the overview to put urgent access first. Feedback from real practices is now shaping the roadmap, not my assumptions.
Urgent access first.
What's next
RoadmapBuilt with
- Next.js
- Vercel
- Supabase
- Postgres
- Python
- Claude Code
- NHS open data